
How to measure behavioral responses to tax reforms
Behavioral responses to taxes are key inputs in evaluations of tax distortions and the trade-off between equity and efficiency (Saez, 2001; Saez et al., 2012), and they serve as evidence on behavioral parameters in economic models more broadly (Chetty et al., 2011a,b).
However, when researchers use tax reforms to identify the strength of such behavioral responses to various types of taxation, they often face the challenge that treatment (e.g., the marginal tax rate) is determined by the outcome of interest (e.g. income). In dealing with this challenge the empirical tax literature has diverged from and modern applied econometrics. In particular, in its lack of ability to validate key identifying assumptions.
In recent work (Jakobsen & Søgaard, 2022), address the gap between the empirical tax literature and modern applied econometrics with the aim of bringing the empirical tax literature up to modern empirical standards. Cast in the context of income taxation, we show that the standard estimation strategy relies on an assumption that any trend differences in income across the income distribution remain constant in the absence of tax reforms. The assumption of constant trend differentials is equivalent to the common trend assumption underlying Difference-in-Difference (DiD) studies, and they show how the assumption can be validated econometrically and graphically, in a way similar to the comparison of pre-trends in DiD studies.
They illustrate our new insights in Figure 1. This stylized figure shows the growth in income across the income distribution for two time periods: a pre-reform period, where the tax schedule remains stable, and a reform period, where the top tax rate is reduced. In both the pre-reform and the reform period, we draw the growth in income as a decreasing function of initial income, which is consistent with mean reversion being the dominant feature of the underlying income process. This pattern is what researchers typically find in real life data, as some individuals are affected by shocks (such as unemployment or payout of an extraordinary large bonus), which temporarily push them away from their normal income level.
Figure 1
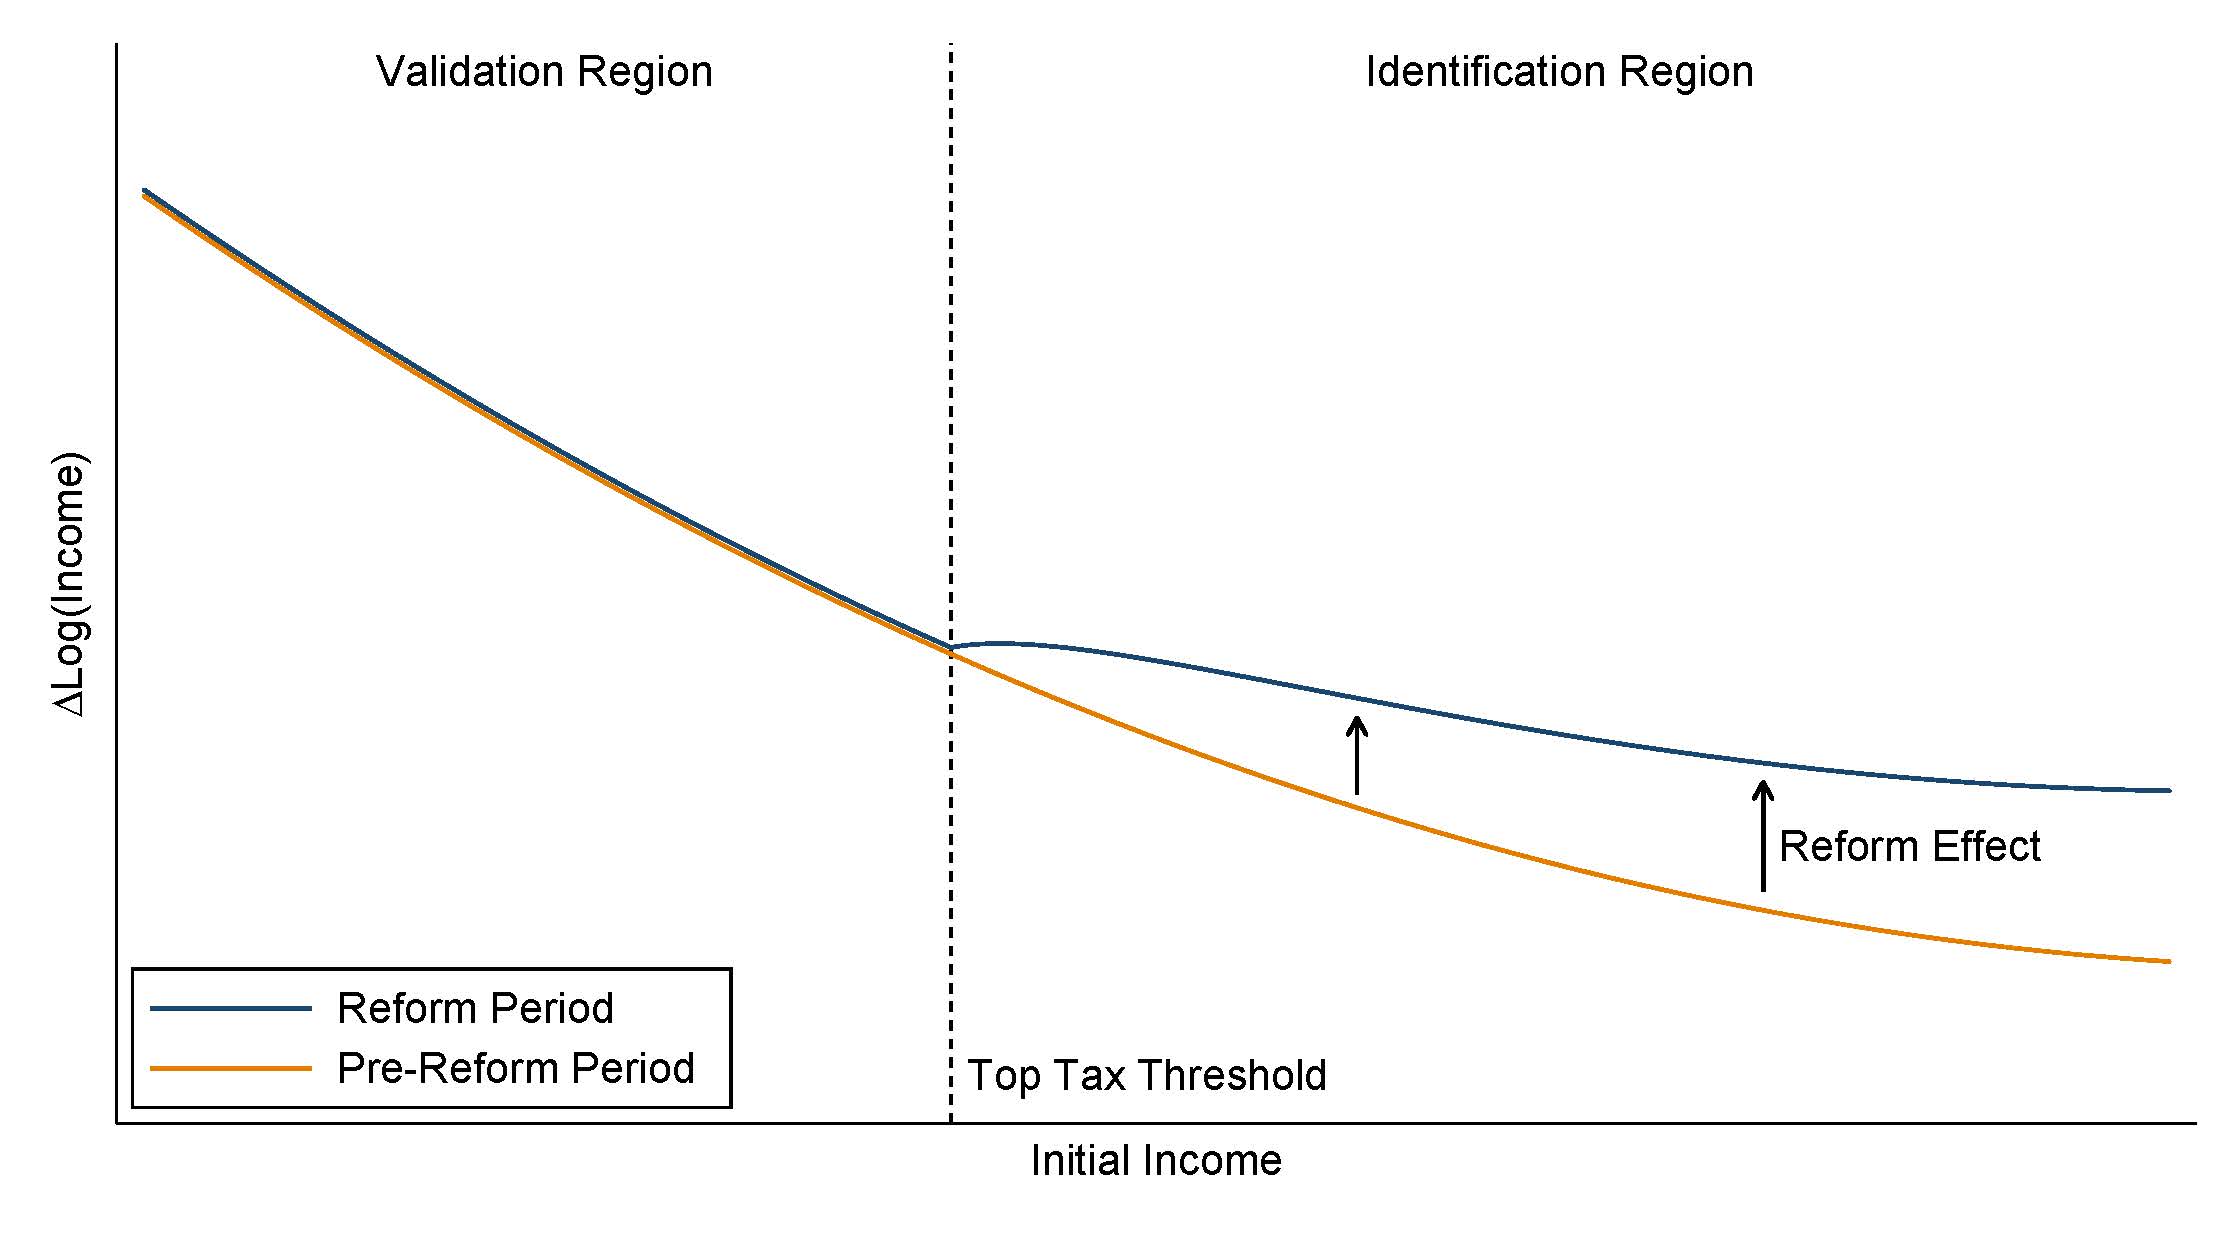 From Figure 1 it clear that a standard DiD analysis of a tax reform is unlikely to capture the true (causal) effect of the reform. A DiD analysis would compare the income growth for the individuals directly affected by the reform (in this case the top tax payers) with individuals not affected by the reform. However, because the underlying income trends of individuals with different initial income are very different, the DiD fails to isolate the effect of the reform.
One way to correct for the different underlying income trends across the income distribution is to consider the changes in trends between the pre-reform and the reform period. These changes in trends isolate the reform effect under the assumption that the pre-reform pattern have remained the same also in the reform period in absence of the reform. How can we validate this key assumption? By comparing the changes in income trends in the part of the income distribution unaffected by the tax reform (the validation region in Figure 1). If the key assumption holds, the pattern in this region should remain constant.
We apply our new approach to a number of tax reforms in Denmark with a particular focus on two reforms implemented in 2004 and 2009-10. The 2004 reform primarily reduced marginal tax rates in the middle of the income distribution, while the 2009-10 reform primarily reduced them at the top, with only minor changes in the bottom. Hence, the 2009-10 reform comes close to the stylized setting in Figure 1.
Figure 2 is the empirical counterpart to Figure 1 for the 2009-10 reform and similar to Figure 1, we see an overall negative relationship between initial income and subsequent income growth consistent with mean reversion. However, we also see a marked difference between the pre-reform and reform periods. In the identification region, where individuals experience a large increase in the marginal net-of tax rate, the growth rate of taxable income in the reform period lies significantly above the growth rate in the pre-reform period (taking into account changes in the overall income growth rate). In contrast, we see essentially the same trend differentials in the two periods in the validation region, where individuals were largely unaffected by the tax reform. We see this as compelling evidence of behavioral responses to the 2009-10 tax reform.
Figure 2
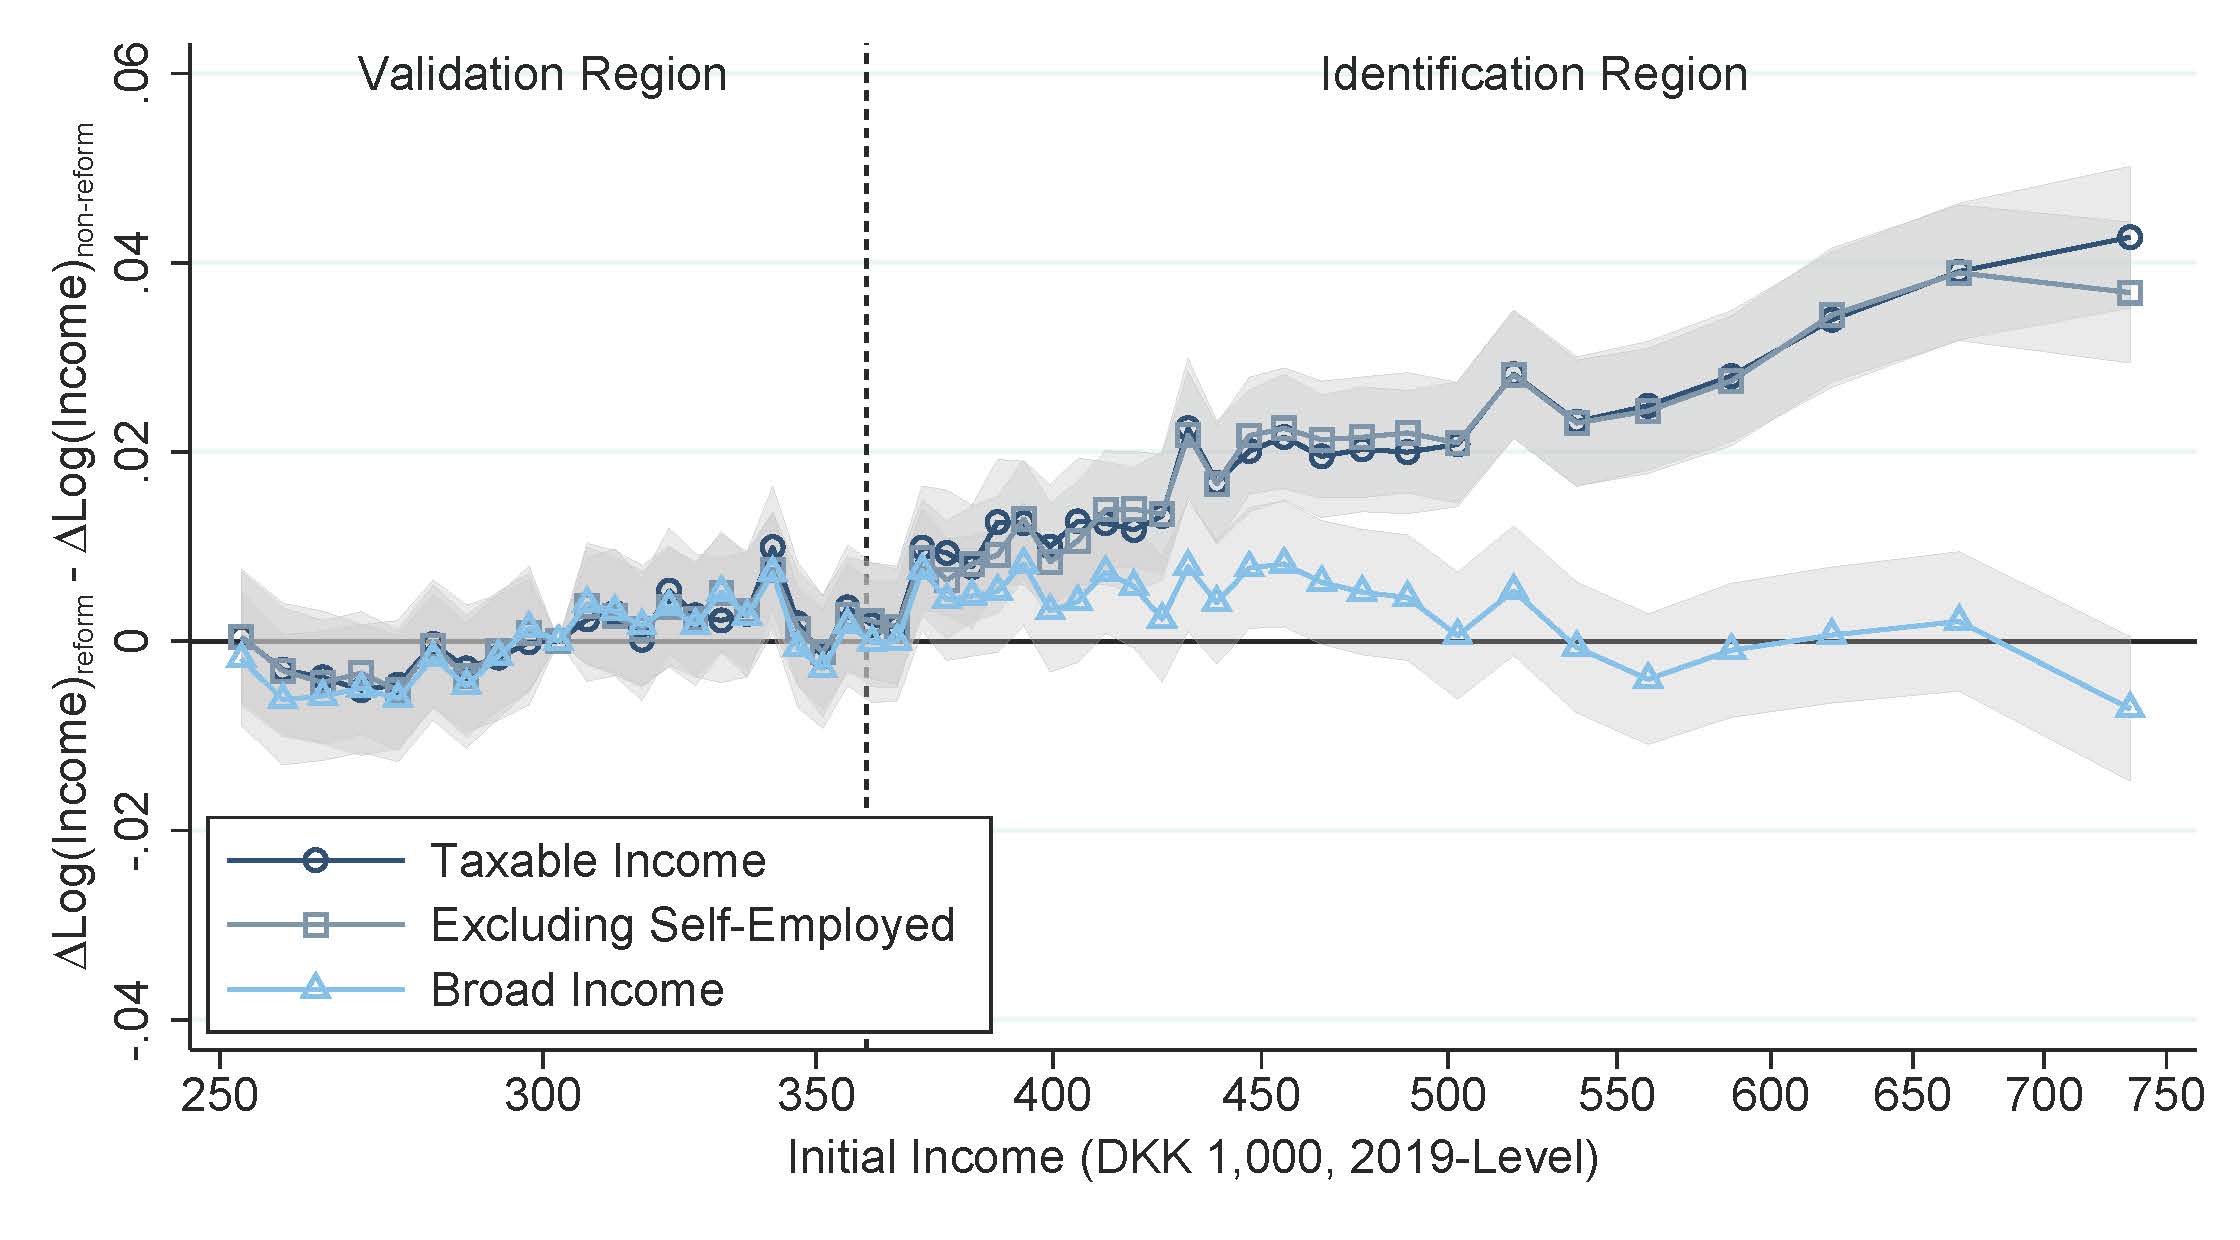
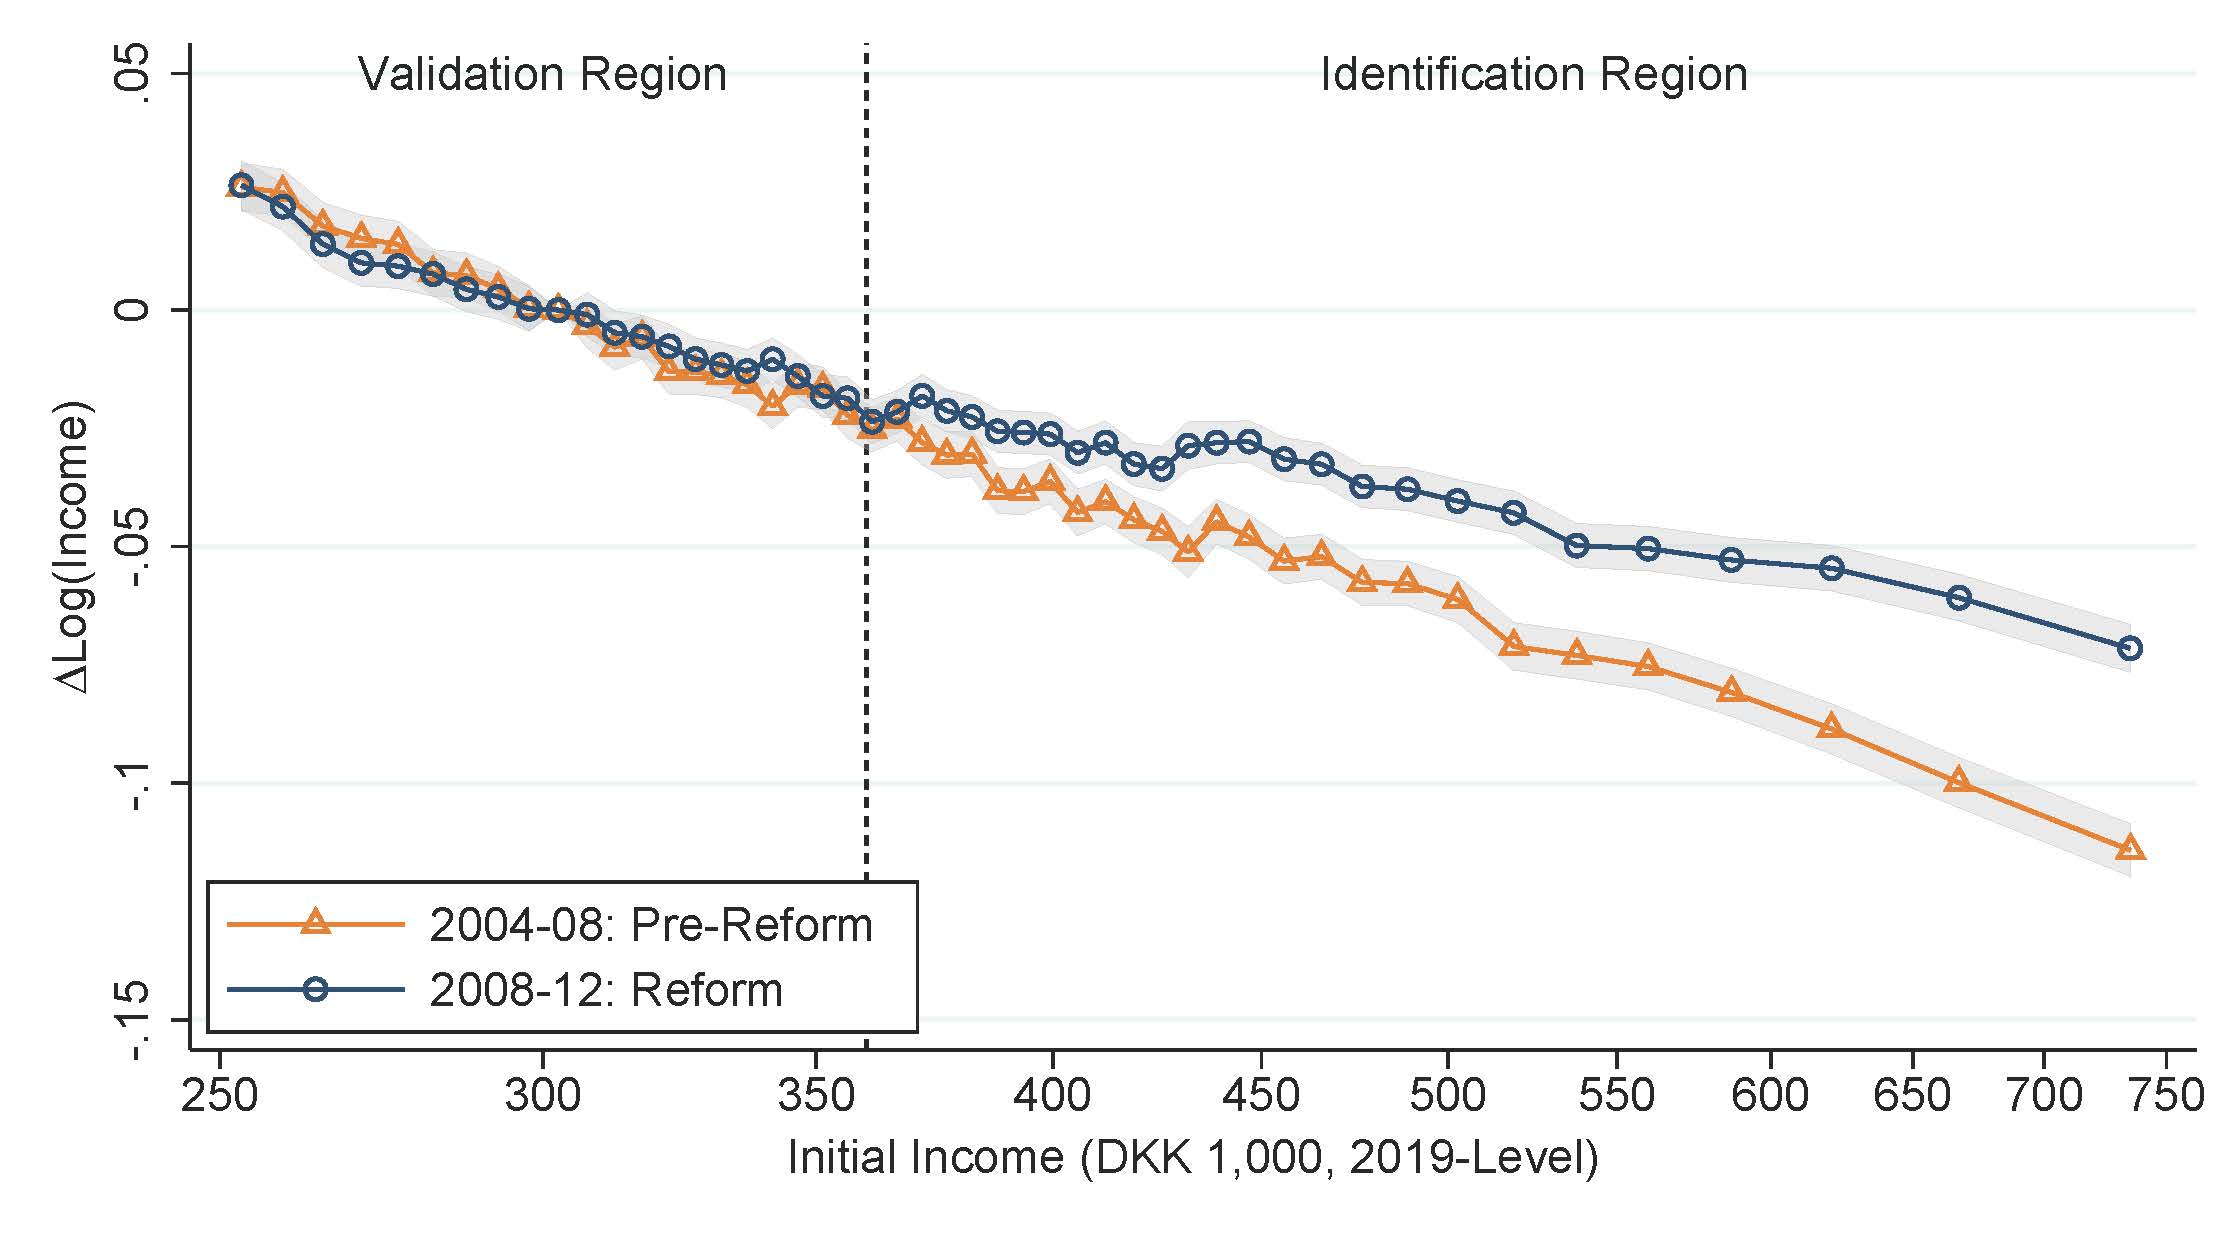 Figure 3 isolates the changes in income trends and considers both taxable income (as in Figure 2) as well as broad income (before various deductions in the tax system). For taxable income, the behavioral responses translate into an average elasticity with respect to the marginal net-of-tax rate of 0.227. However, as evident from Figure 3, most of the effect disappears when considering broad income, and in particular, we find that most of the responses are driven by income shifting from pension contributions to taxable income induced by the reform. Using broad income that is unaffected by the shifting of income, we find an elasticity of 0.016.
Figure 3
References
CHETTY, RAJ, FRIEDMAN, JOHN N., OLSEN, TORE, & PISTAFERRI, LUIGI. 2011a. Adjustment
Costs, Firm Responses, and Micro vs. Macro Labor Supply Elasticities: Evidence
from Danish Tax Records. The Quarterly Journal of Economics, 126(2).
CHETTY, RAJ, GUREN, ADAM, MANOLI, DAY, & WEBER, ANDREA. 2011b. Are Micro and
Macro Labor Supply Elasticities Consistent? A Review of Evidence on the Intensive and
Extensive Margins. In: American Economic Review: Papers & Proceedings, vol. 101.
SAEZ, EMMANUEL. 2001. Using Elasticities to Derive Optimal Income Tax Rates. Review of
Economic Studies, 68(1).
SAEZ, EMMANUEL, SLEMROD, JOEL, & GIERTZ, SETH H. 2012. The Elasticity of Taxable
Income with Respect to Marginal Tax Rates: A Critical Review. Journal of Economic Literature,
50(1).