How far are labour supply behaviour from Homo Economicus?
Most economists are well aware that the models based on perfectly rational and optimising individuals, which we teach our students, are only approximations of real life behaviour. The key questions are what the size and consequences are of the differences between model predictions and real life behaviour. In the case of the effect of taxation on labour supply, the emergence of big data has shown that there is profound differences between the predictions from our standard models and observed labour market behaviour. Researchers have sought to explain these discrepancies by the presence of optimisation frictions: i.e. individuals fail to optimise correctly when the stakes are low due to various behavioral factors such as inattention, adjustment costs etc. However, optimisation frictions have the potential to explain nearly everything and it is therefore critical to investigate settings in which the presences of optimisation frictions could potentially be falsified.
One of the key insights that have emerged from the last two decades of research in public and labour economics is just how important optimisation frictions are in shaping observed labour market outcomes. Optimisation frictions are the likely cause of the lack of observed bunching at kink points (Saez, 2010 and Chetty et al., 2011) as well as the range of different labour supply elasticities estimated using tax reforms (Chetty, 2012).
Yet, despite the growing recognition that both the magnitude and nature of optimisation frictions are important for our understanding of the labour market, concrete evidence of optimisation frictions is still limited. This reflects that identification of optimisation frictions is demanding in terms of both high-quality data and special institutional settings. High-quality data are needed to separate optimisation errors by individuals from measurement errors in the data, and special institutional settings are needed to separate optimisation errors from preference heterogeneity.
In recent work (Søgaard, 2019), I use Danish administrative data to investigate the magnitude and nature of optimisation frictions in the labour market of Danish students. This particular labour market represents a promising case study for several reasons. First, students face a sharp kink in their budget set created by the phase out of student benefits.
The kink is large: more than twice the size of the largest kinks in both the US and Danish tax systems. Second, a reform in 2009 significantly increased the earnings level at which students reach the kink point. Third, students need to adjust their take-up of benefits before actually receiving the benefits to remain on a lower phase-out rate. If they fail to do so sufficiently, they risk hitting an ex post phase-out rate of 100 percent. This feature creates several dominated regions in their budget set. Finally, the labour market is covered by rich administrative data on earnings and benefits take-up at the monthly frequency.
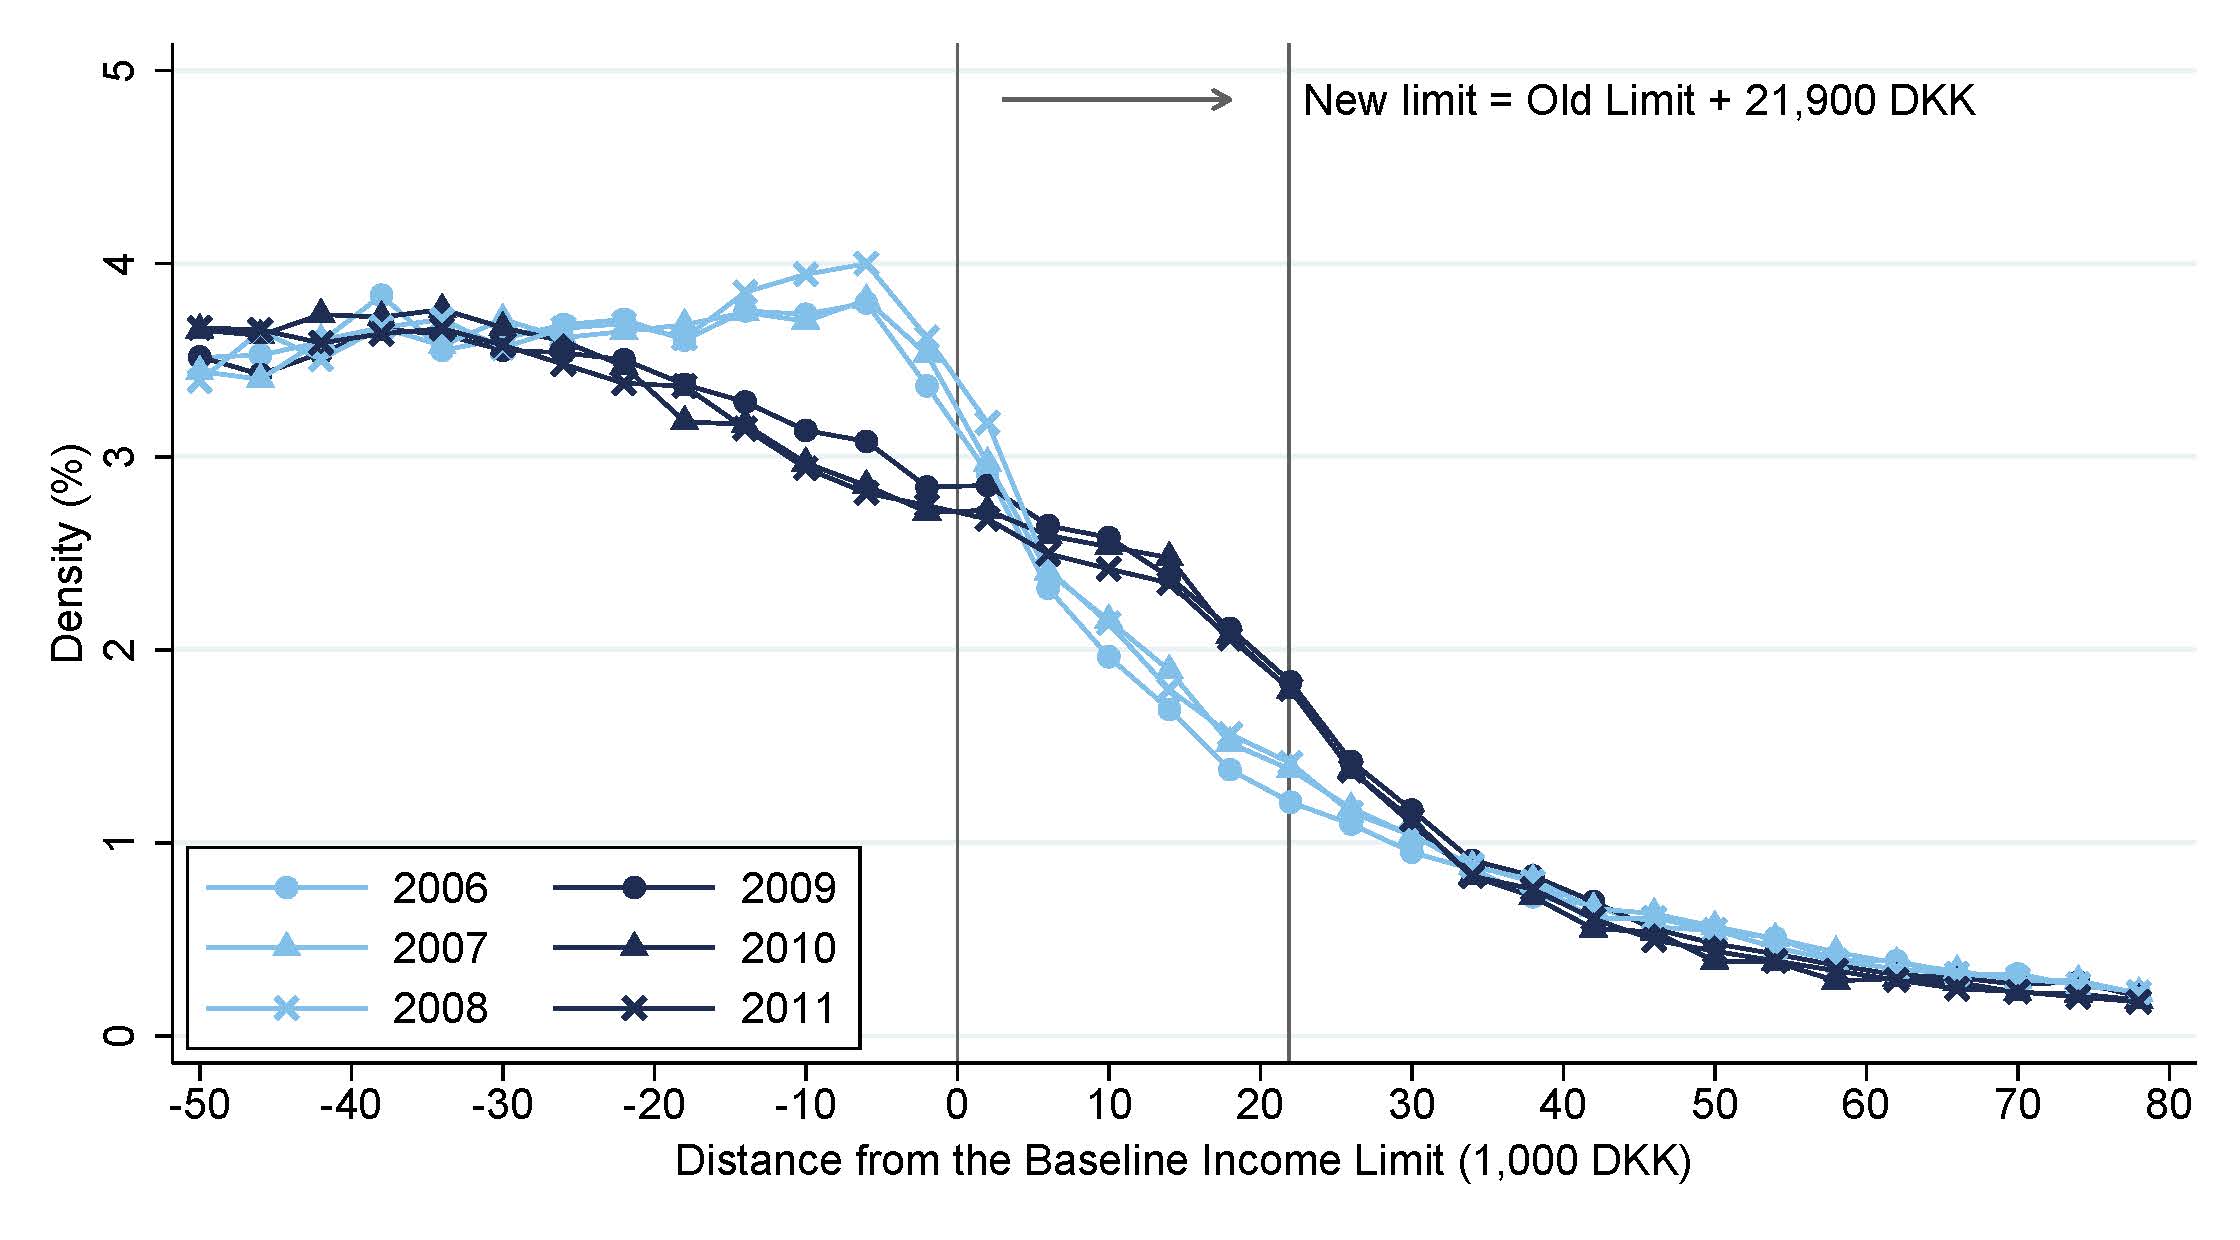
Overall, my main findings point to the presence of significant optimisation frictions. First, as illustrated in Figure 1, I find an immediate and non-trivial shift in the earnings distribution following the 2009 reform compared to stable distributions both before and after the reform. The shift is consistent with a labour supply elasticity of 0.1. Yet, despite this clear evidence of a positive labour supply elasticity, I find no sign of sharp bunching at the kink point, created by the phase-out of student benefits, which our standard labour supply models predict.

Figure 1: The earnings distributions of Danish students before and after the 2009 reform
Second, I find that a significant share of individuals fails to take up benefits optimally given their final end-of-year earnings. I show this by utilising that the Danish student benefit system allows students to earn income up to a baseline income limit without having their benefits reduced.
If they earn more, their benefits are phased out. For the first DKK 11,600 above the limit the phase-out rate is 50 percent, while further earnings entail a phase-out rate of 100 percent. If students want to earn more, they can increase the income limit by cancelling benefits for one or more months. For each month cancelled, the student increases the income limit by DKK 11,600, which translates into a phase out rate of 6,100/11,600 = 52 percent.
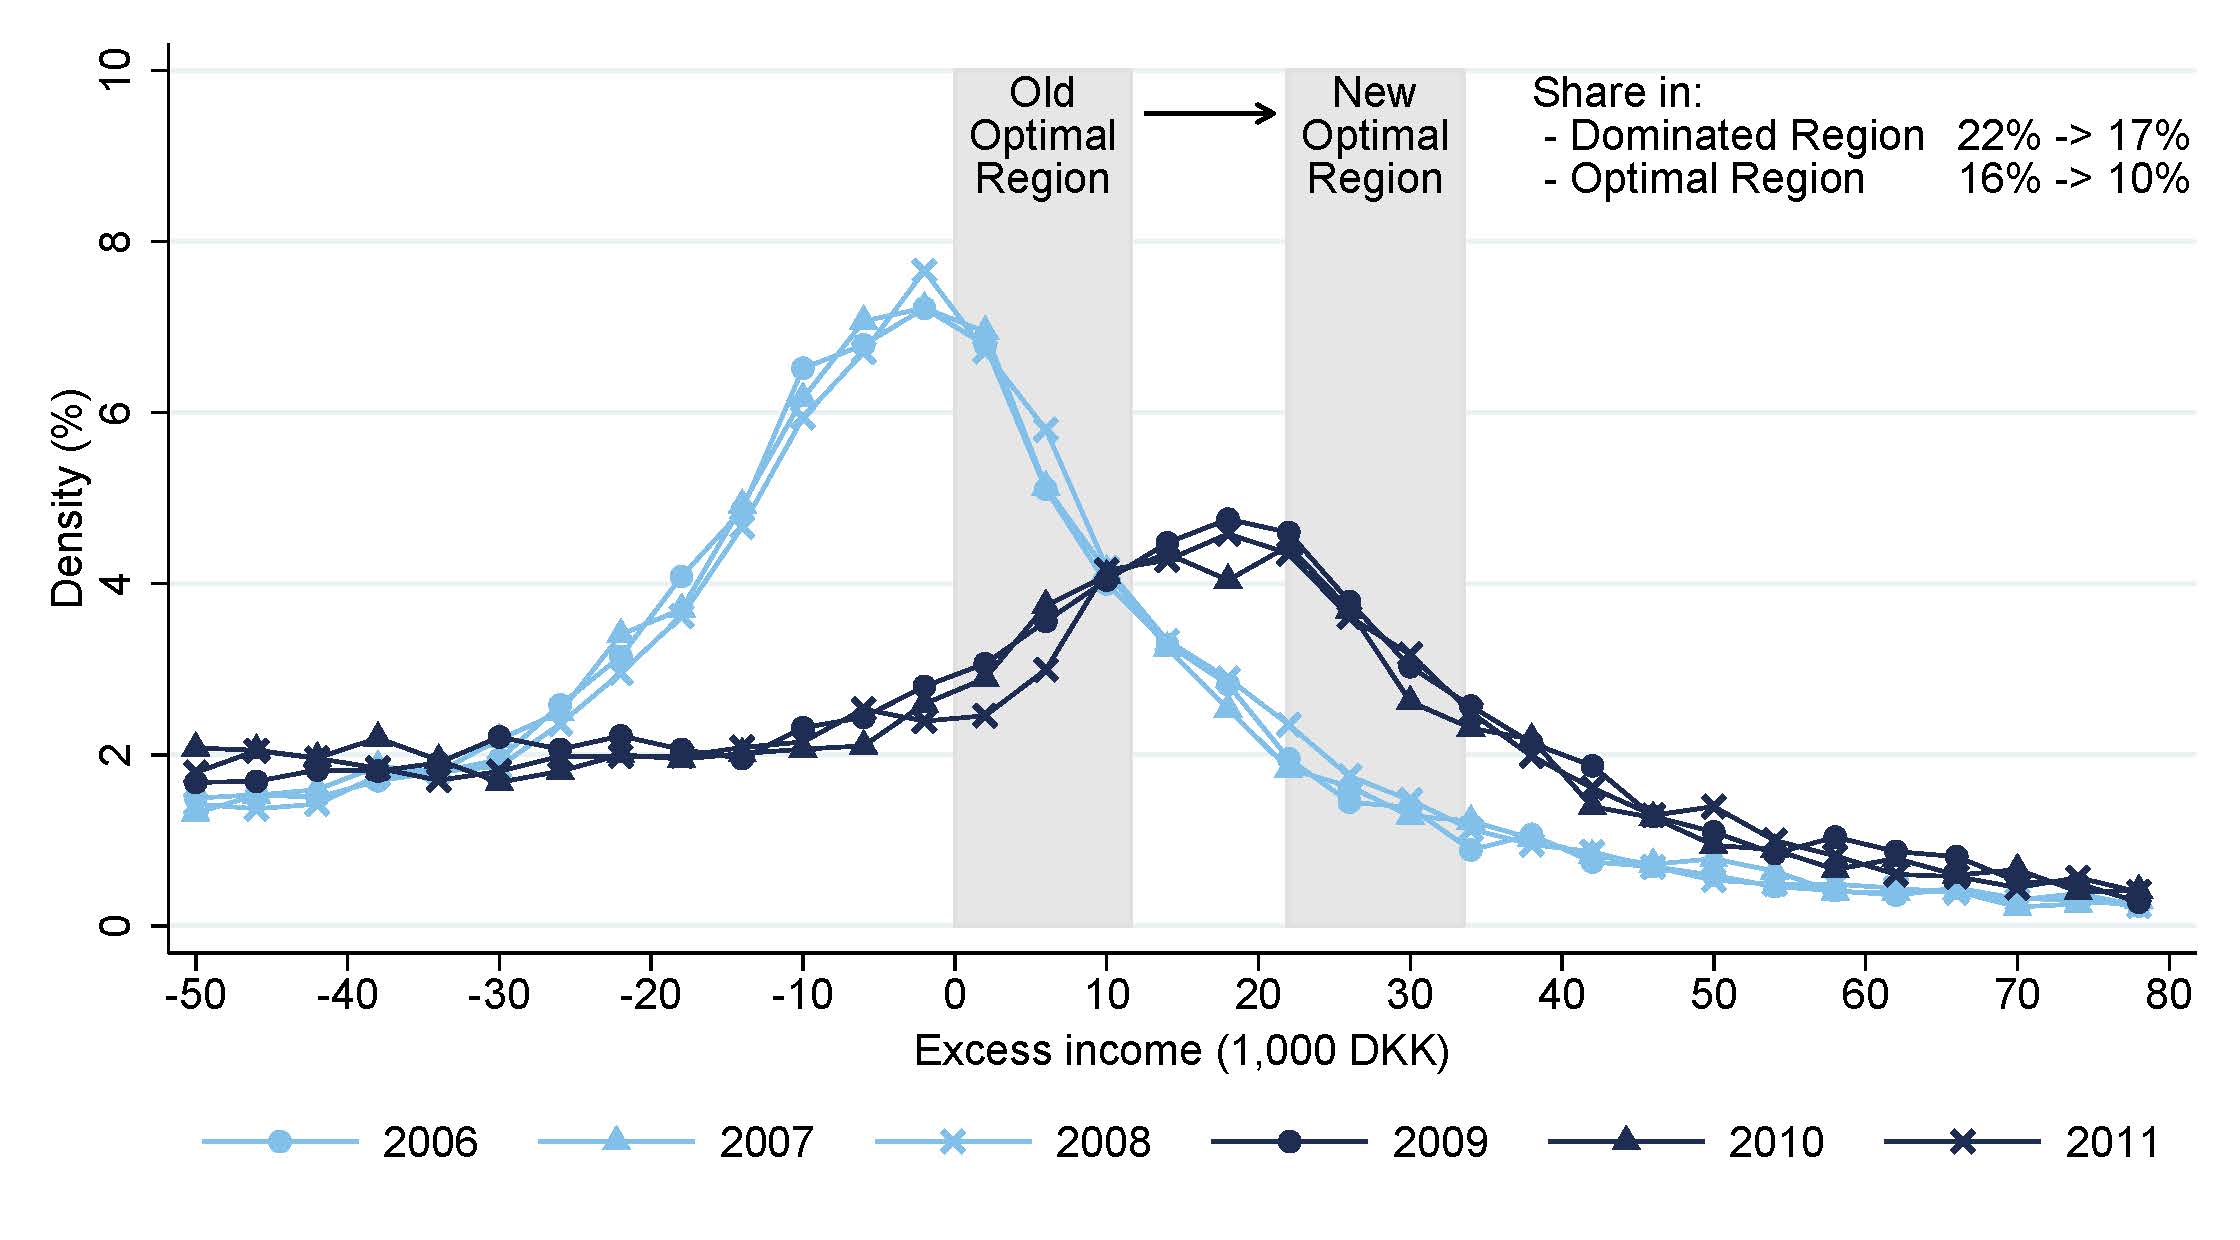
Because the system implies a lower phase-out rate if students actively adjust their take-up of bene-fits, students maximise their disposable income by cancelling an increasing number of months of benefits as their earned income increases. However, as I show in Figure 2, most students have earnings lying outside the optimal interval. Most students could – in other words – have increased their disposable income by either taking-up or cancelling an additional month of benefits.

Figure 2: Distributions of excess income for students, who actively cancel at least one month of student benefits.
The costs of these “optimisation errors” in terms of lost disposable income are not trivial, but amount to on average 2-3 percent of students’ disposable income. This estimated range of “accepted utility losses” is well above the level explained by the lack of sharp behavioural responses to even significant kinks or changes in the tax schedule.
However, because the kink created by the phase out of student benefits is extraordinarily large, the costs of ignoring the kink completely is likely to be above 3 percent. Hence, my findings are consistent with individuals responding to incentives once the stakes become large enough, even though they fail to optimise exactly as standard economic theory would predict.
References
- Chetty, R. (2012). Bounds on Elasticities with Optimisation Frictions: A Synthesis of Micro and Macro Evidence on Labour Supply. Econometrica. The Econometric Society. You can find the paper in Econometrica here.
- Chetty, R., Friedman, J. N., Olsen, T., & Pistaferri, L. (2011). Adjustment Costs, Firm Responses, and Micro vs. Macro Labour Supply Elasticities: Evidence from Danish Tax Records. The Quarterly Journal of Economics, 126(2), 749–804. You can find the paper in Quarterly Journal of Economics here.
- Saez, E. (2010). Do Taxpayers Bunch at Kink Points? American Economic Journal: Economic Policy, 2(3), 180–212. You can find the paper in American Economic Journal: economic Policy here.
- Søgaard, J. E. (2019). Labour Supply and Optimisation Frictions: Evidence from the Danish Student Labour Market. Journal of Public Economics, 173, 125–138. You can find the paper in Journal of Public economics here.
